Google Core Web Vitals (Web Core Vitals) has been hot for a few years and has become a new generation of Web performance experience and quality metrics. Basically, all blogs that talk about WordPress speed optimization mention it. What are Core Web Vitals and why are they important for WordPress? How to optimize them?
This article will all cover everything you need to know about Core Web Vitals and how to optimize them on your WordPress site. We'll tell you what they are, how to optimize them to improve speed scores and user experience, and even improve Google search rankings.
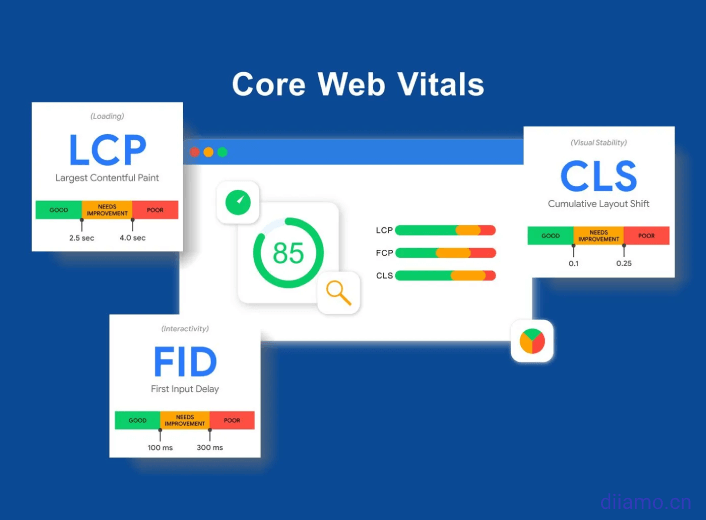
What are Core Web Vitals?
Core Web Vitals is a website quality scoring program launched by Google to measure and improve the web user experience. The specific performance isGoogle Speed Test3 scoring items inside. Largest Contentful Paint (maximum content drawing), theFirst Input Delay (first input delay), the Cumulative Layout Shift (cumulative layout offset).

Rather than simply measuring total page load time, Core Web Vitals focuses on a site's performance and items related to user experience - simply put, how quickly a user can begin interacting with a page. It is a better measure of a website's performance and user experience than total load time, and is currently a key metric for speed testing and optimization.
Now you should probably understand what Core Web Vitals is, below we will explain in the simplest way what Core Web Vital means and how to optimize it to help you get more traffic to your website.
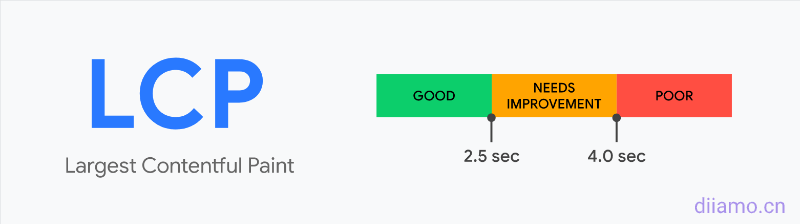
What is Largest Contentful Paint (LCP)?
Largest Contentful Paint (LCP)Refers to the maximum content drawing time, reporting the largest image or block of text (the most meaningful content) visible in the visible area that finished rendering based on the point in time when the page first started loadingRelative Time(not the actual loading time).
The ↓ green area below is the LCP content.


LCP is an important user-centric metric for measuring perceived loading speed, as the metric marks the corresponding point in the page load timeline when the main content of the page is essentially loaded, and a swift LCP helps reassure the user that the page is valid.
The LCP content of a page may not be fixed, but changes dynamically, and the LCP content lines vary from one loading time period to another. In most cases the LCP content is the largest content at the top of each page of the website, generally referring to the home page Banner image, the featured image at the top of the page, the top text area, etc.
The LCP does not currently calculate all elements, as this would make this indicator very complex, it now focuses only on the following elements.
<img> Element
element inside element
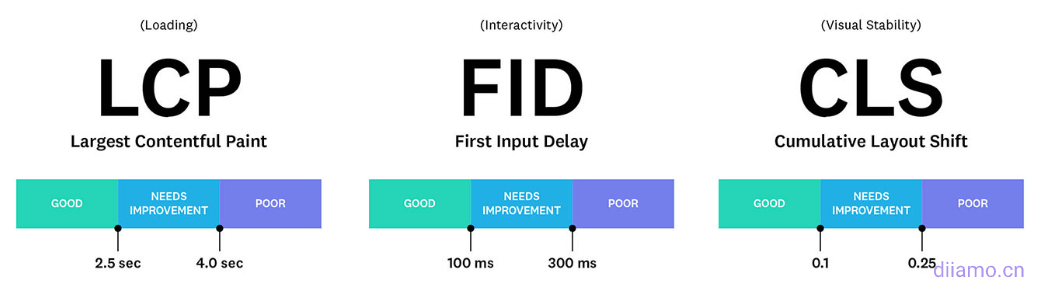
What is a good LCP time? Please see the following Google thresholds.
- Good - Less than or equal to 2.5 seconds.
- Needs improvement --Less than or equal to 4.0 seconds.
- Difference --over 4.0 seconds.
LCP is affected by TTFB, resource loading delay, resource loading time, and element rendering delay ↓.
| LCP sub-section | Improvement methods (influence factors) | Impact weight |
|---|---|---|
| TTFB | Mainly hosting and CDN + full page caching | ~40% |
| Resource loading delay | Exclude first screen content from optimization, resource tips | <10% |
| Resource loading time | Reduce image/CSS/JS size, critical CSS, CDN, cache expiration | ~40% |
| Element rendering delay | Rendering blocking CSS/JS, JS file size, font display optional | <10% |
Side note: LCP is very similar to First Contentful Paint (FCP), which is another metric included in PageSpeed Insights. The key difference is that LCP is loaded when theMain"FCP focuses on "First"The time it takes for content to load - perhaps a launch screen or a loading indicator - is a less relevant UX element.
What is Cumulative Layout Shift (CLS)?
Cumulative Layout Shift (CLS)Refers to cumulative layoutOffsetThe CLS score is simply a measure of whether the content moves during page loading. The more it moves, the higher the score (poor), and the lowest score (excellent), the CLS score is equal to or less than 0.1 to achieve "good".

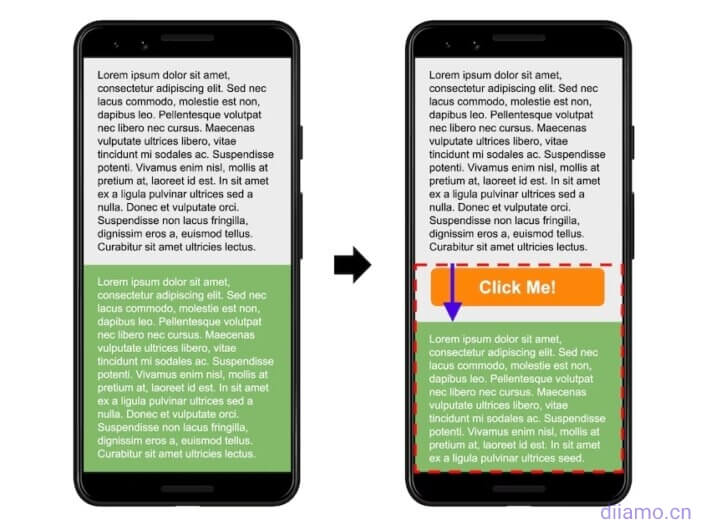
The page loads when the following red box text block at the beginning of the display at the top, as the code loads the rendering text block moves to a distance of 25% from the top of the position ↓, this is the layout offset.
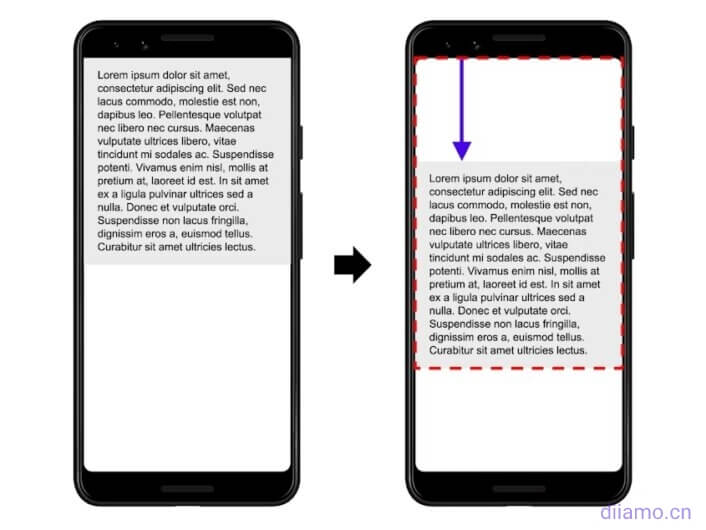
When the page is loaded at the beginning, the position of the text block in the red box in the figure below is 50% from the top, and then the orange button is displayed and the position of the text block in the red box is shifted down, which is also a layout offset.
The cumulative layout offset (CLS) is a measure of theVisual stabilityis an important user-centered metric because it helps quantify how often users experience unexpected layout shifts, and a lower CLS helps ensure that a page is pleasing to the eye and improves the user experience.
Cumulative layout changes are very annoying to users and how they will have a bad experience. What is a good CLS score? Please see the following Google thresholds.
- Good - Less than or equal to 0.1.
- Needs improvement --- Less than or equal to 0.25.
- Difference --over 0.25.
What is First Input Delay (FID)?
First Input Delay (FID) refers to the first input delay, i.e., the time between the visitor's first interaction with the web page and the browser's beginning to process (and not finish processing) the interaction, which can be interpreted as the time from when you order at a restaurant → to when the chef receives the order and starts making it. JS is often the main factor affecting FID.
FID measures only the "latency" of the event handling process; FID does not measure either the time spent on the event handling itself or the time spent by the browser updating the user interface after the event handler is run. Some pages may not have an interactive element and therefore do not have a FID impact.

First Input Delay is different from Time to Interactive (TTI), although the two are very similar. TTI measures the time it takes for a page to fully interact, which can be interpreted as the time from when you order at a restaurant → to when the meal is prepared and delivered to you.
The first input delay (FID) is a measure ofLoad ResponsivenessAn important user-centric metric because it quantifies the user's experience when trying to interact with an unresponsive page, and a low FID helps assure the user that the page is valid.
What is a good CLS time? Please see the following Google thresholds.
- Good - Less than or equal to 100 milliseconds
- Needs improvement --Less than or equal to 300 ms
- Difference --More than 300 milliseconds.
Core Web Vitals affects SEO ranking results
In June 2021, Google began using Core Web Vitals as one of its ranking factors, and these metrics may affect your SEO performance. core web vitals will be part of the new page experience signal.
Core Web Vitals will affect both mobile and desktop search results, and your site will need to meet a specific minimum Core Web Vitality score to appear at the top of search results in popular stories and in headlines.
More importantly, it seems to requireMeet all Core Web Vitals metricsOnly then can you improve your ranking.No indexed pagesThe Core Web Vitals score is also important.
In short: to get better SEO results, you must improve your website's Core Web Vital score.
How to use PageSpeed Insights to detect website Core Web Vitals
The following chart lists some tools that can check Core Web Vitals scores, such as PageSpeed Insights, Chrome DevTools, CrUX Report, etc. We recommend usingPageSpeed InsightsTest Core Web Vitals, because this is the official Google speed test tool results are more reliable and the test results have optimization suggestions given.

Detection method.
Open the wall software, then open the official website of PageSpeed Insights Google test tool (https://pagespeed.web.dev/), enter the URL of the page to be tested and click "Analyze" to start testing the site. Each page needs to be tested.

The LCP and CLS scores are displayed in the test results.
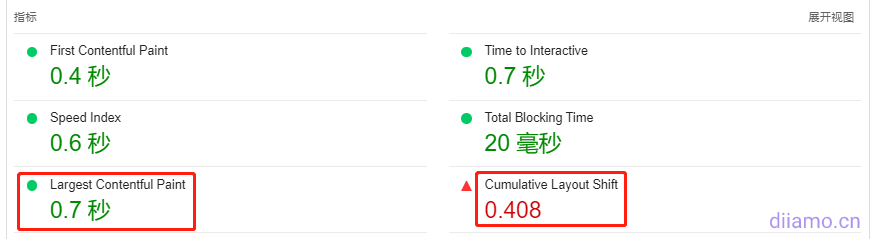
The FID (First Input Delay) is based on actual user data and therefore is not shown in the test scores. The FID time is only visible in the Field Data section when enough data has been collected for the CrUX report. In the test results, theTotal Blocking Time (TBT) In place of FID, FID scores can be improved simply by improving TBT.

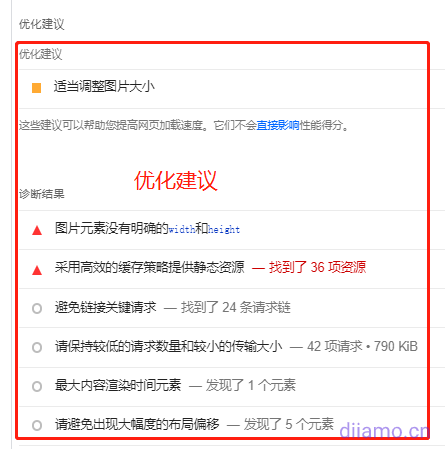
Below the picture of the test results ↓ click on the corresponding content can be viewed to affect the FCP, TBT, LCP, CLS content (optimization recommendations).

Optimization suggestions ↓.
Caution.
- Core Web Vitals scores may vary slightly between Field and Lab Data. This is normal, depending on how the data is collected.
- There may not be any field data when running testsThis is because there is not enough real user data available. It will not affect your Core Web Vitals because PageSpeed Insights takes into account lab data for page speed scores.
- Always check mobile and desktop results. Your Core Web Vitals metrics will vary between the two. Keep in mind that mobile scores are the most relevant andThe most challenging.
How to view the entire site Core Web Vitals report in Search Console
PageSpeed Insights detects individual page Core Web Vitals reports, if you want to diagnose the whole website, you can use the Core Web Vitals report in Google Search Console (Google Webmaster Tools).
The report is based on aggregated real user data from CrUX, so it takes some time after the site goes live to view the data. core Web Vitals reports are perfect for identifying groups of pages that need attention, whether desktop or mobile.
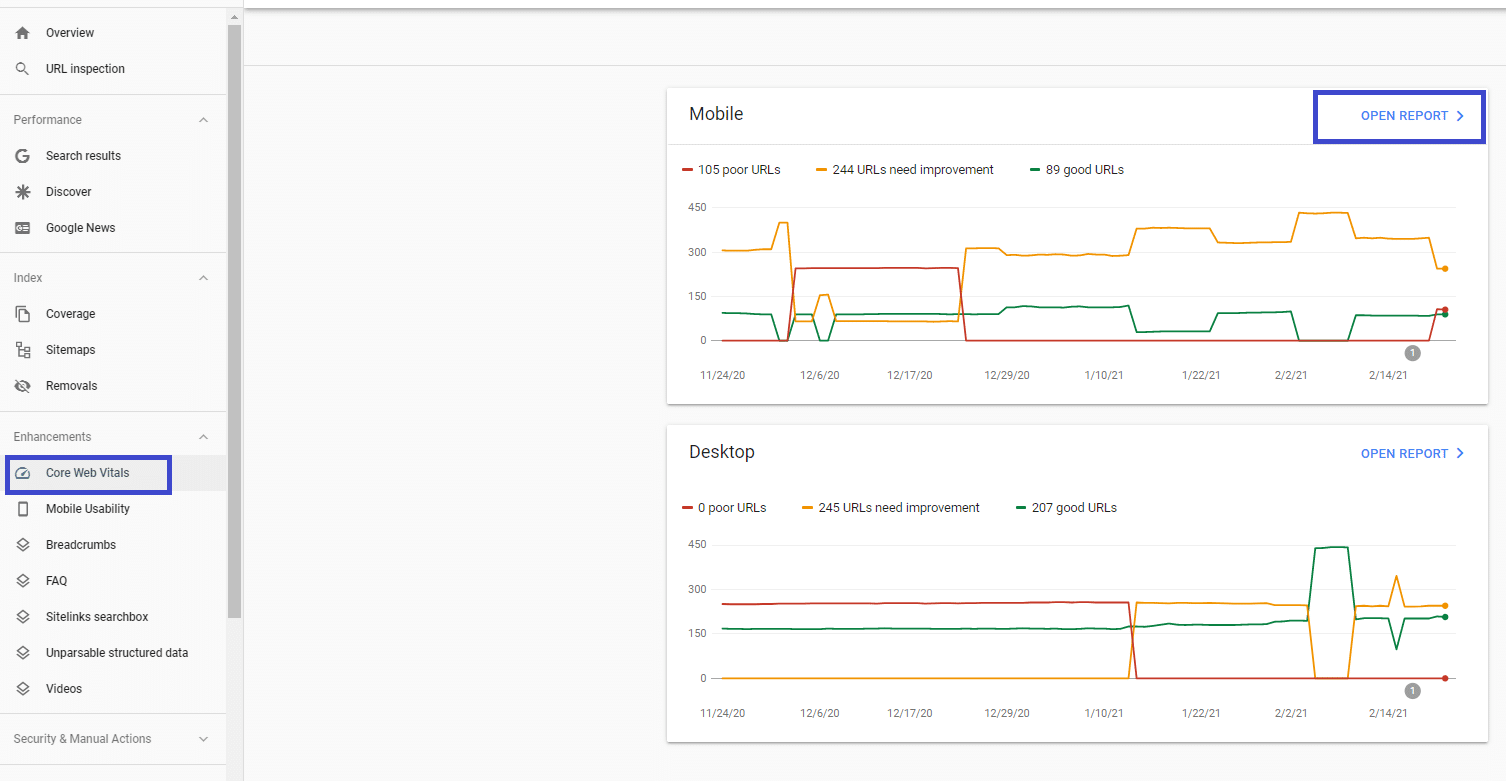
When you open the report, you will find a details tab that groups URL performance by several criteria.
- Status (poor or needs improvement)
- Type of indicator (e.g., CLS question: greater than 0.25 (desktop))
- URL groups (lists of URLs with similar performance).
After fixing the URLs that need improvement, you can also click on the "Validate" column and continue with the "Validate Fix" option. Remember, the validation process can take up to two weeks - please be patient!

How to improve your website Core Web Vitals score
Core Web Vitals score is closely related to the speed of the website, which involves all aspects of the website, Core Web Vitals optimization method is the same as the speed optimization method, as long as the website speed is fast enough Core Web Vitals score is naturally good. So focus on speed optimization and try to optimize your mobile and computer scores to above 95.
We wrote theThe Ultimate WordPress Website Speed Optimization Tutorial》, TheAdvanced Advanced WordPress Optimization TutorialHelp you to fully optimize the speed of the site in depth, from optimization ideas to methods to tools to teach, so that your site pages open in seconds!
After following the tutorial to optimize your website, usePageSpeed InsightsTest the main page speed, according to the optimization to improve the check and perfect can be.